
Objective
To help users understand how to access, interpret, and customise reports in Google Analytics 4 (GA4) — enabling better insight into user behaviour, traffic sources, and business performance.
Overview
In this SOP, you’ll learn how to:
- Access the reports section and interpret report types
- Navigate overview vs. detailed reports
- Use key report types like user acquisition and traffic acquisition
- Adjust dimensions, filters, and date ranges
- Customise your report collections and share them with stakeholders
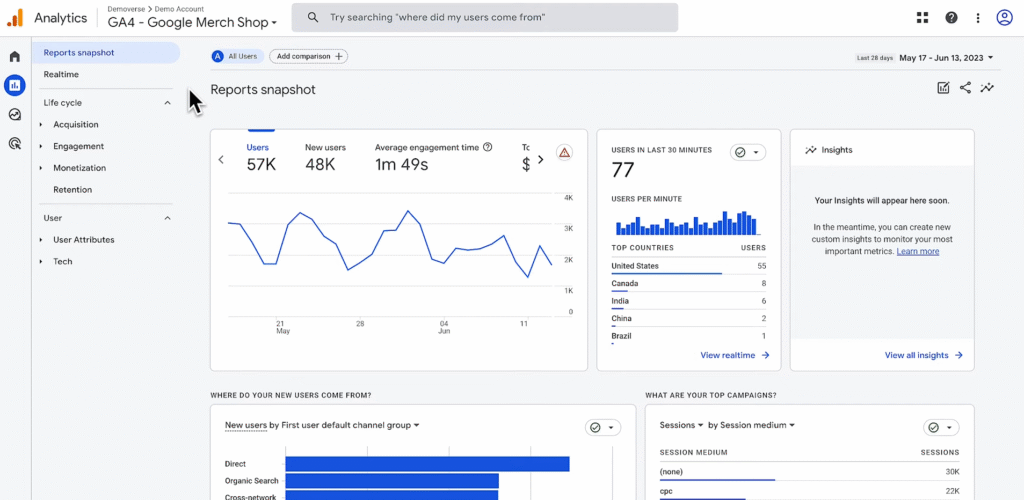
Step 1: Access the Reports Section
To begin analysing your data:
- In the left-hand navigation menu, click the Reports icon
- You’ll land on the Reports snapshot and Realtime report
- Below these are two main default collections:
- Lifecycle reports – covering acquisition, engagement, monetisation
- User reports – covering tech and demographic information
Your default collections may vary based on your initial property setup, but you can customise them later.
Step 2: Understand Report Types in GA4
There are two primary types of reports:
| Report Type | Description |
| Overview Report | High-level summary using cards with top metrics and visuals |
| Detail Report | Drilldown view with one or two dimensions in a table format |
Each card in an overview report includes:
- A data quality icon (shows sample size or thresholds)
- A filter icon if filters are applied
- A “View” link to open a more detailed report from the card
Hover over icons for more detail.
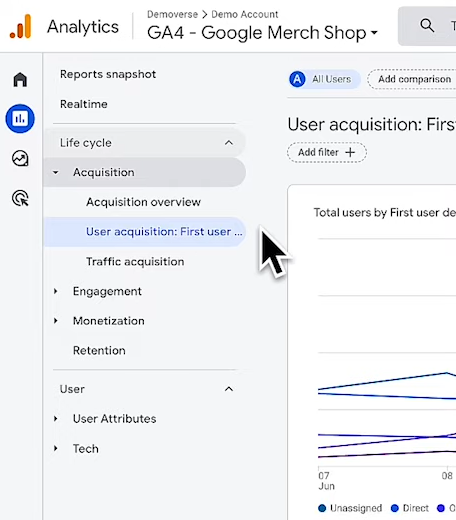
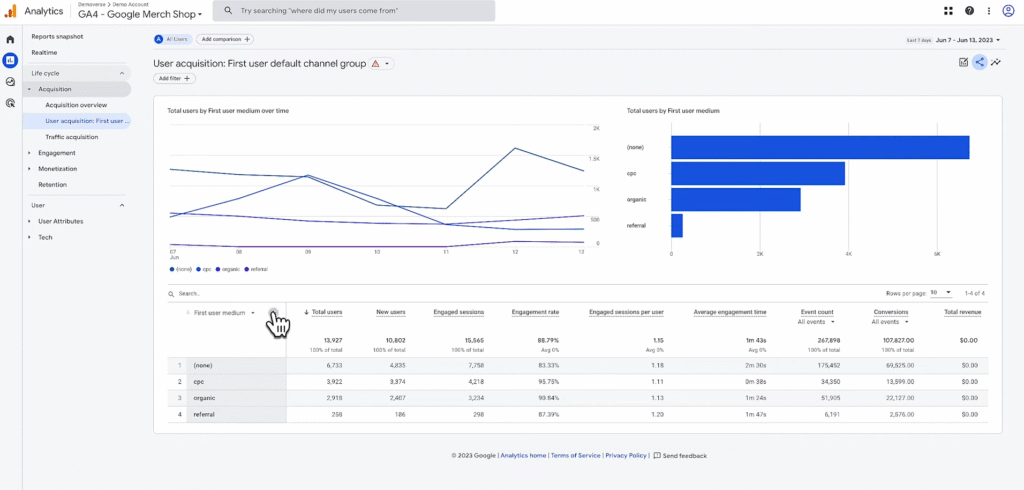
Step 3: Use the Acquisition Reports
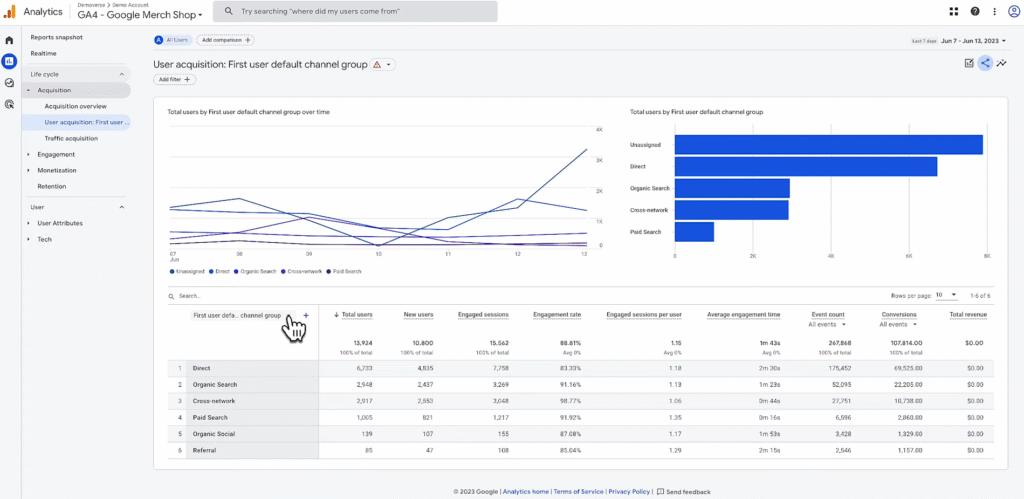
User Acquisition Report
This report shows how new users find your site or app for the first time.
Primary dimensions include:
- First user source (e.g., Google)
- First user medium (e.g., CPC)
- First user campaign (e.g., Summer_Sale2024)
“First user” indicates how the user was originally acquired — not subsequent sessions.
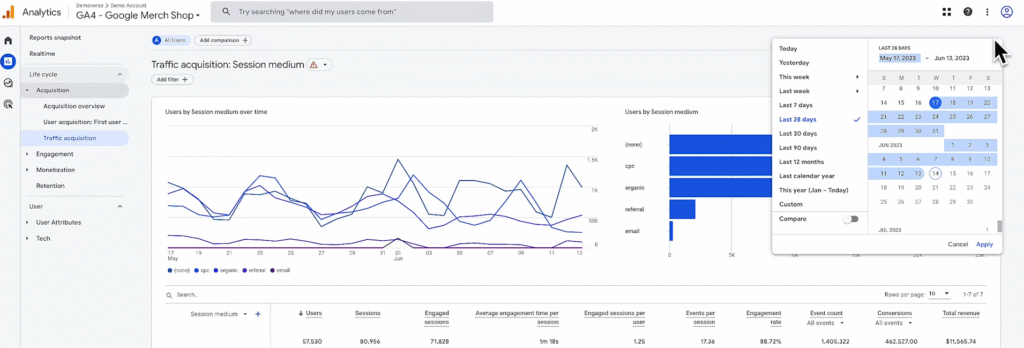
Traffic Acquisition Report
This report shows how sessions were started — regardless of whether the user is new or returning.
Dimensions include:
- Session source
- Session medium
- Session campaign
Sessions reflect grouped user actions (e.g., from landing on your site to exiting).
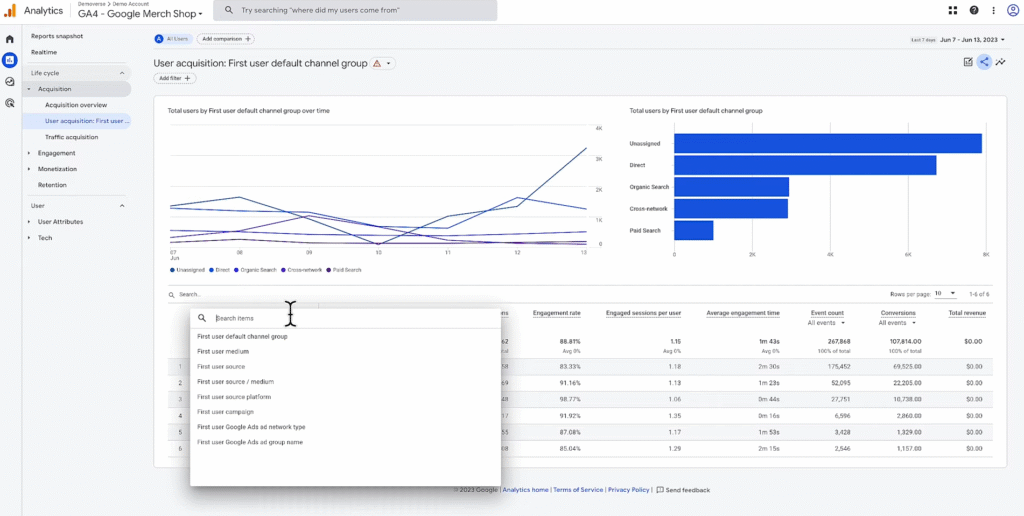
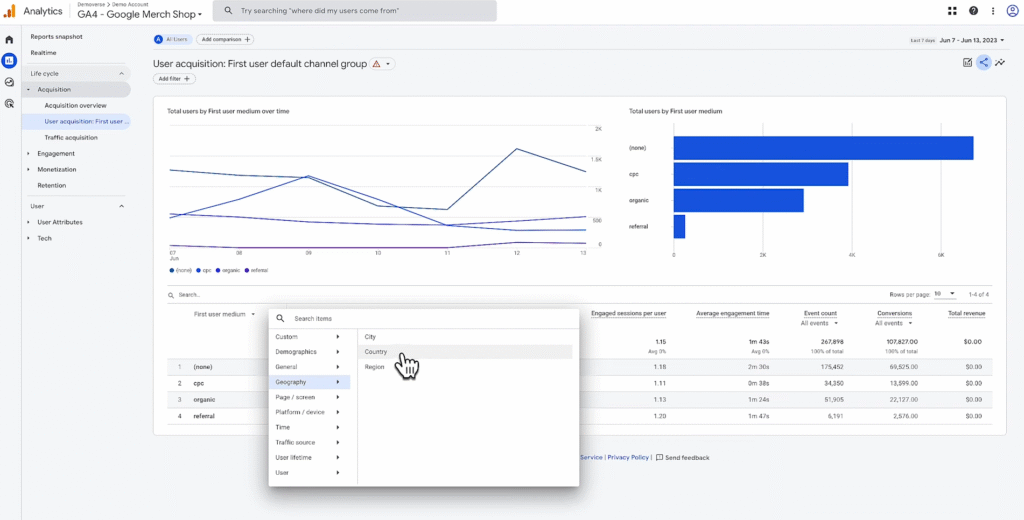
Step 4: Adjust Dimensions and Filters in Reports
You can change the primary dimension in most reports:
- Click the dimension dropdown (e.g., “First user source/medium”)
- Choose a different dimension (e.g., campaign, keyword)
- To add a secondary dimension:
- Click the + icon
- Choose from the list (e.g., Country, Device Category)
Adding secondary dimensions helps uncover layered insights — such as source by country.
Step 5: Customise Date Ranges and Share Reports
To change the date range:
- In the top right of any report, click the date range dropdown
- Choose from:
- Last 7 days, 28 days, 90 days
- Custom range
To share a report:
- Click the Share icon in the top-right corner
- A link is generated with your current view (including filters and date range)
Only users with access to the GA property can open the shared report link.
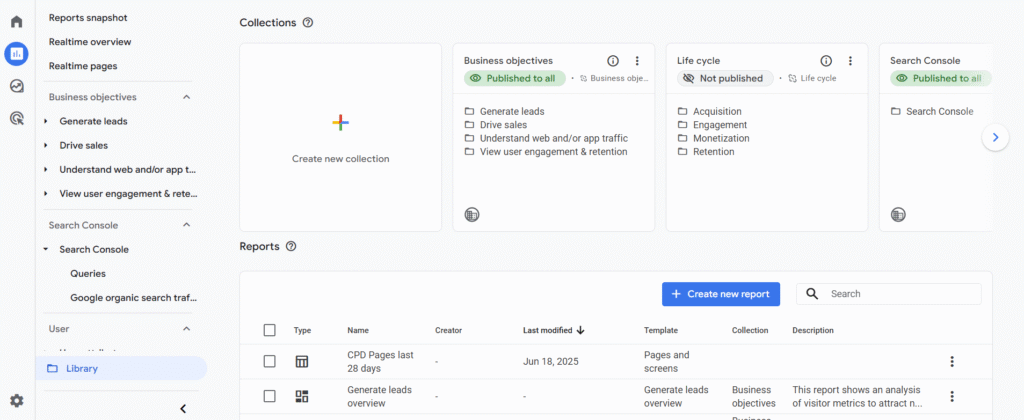
Step 6: Customise Your Report Collections (Editor Role Required)
To adjust which collections appear in your reports navigation:
- Go to Reports → Library (bottom of the left panel)
- From here, you can:
- Add pre-built collections (e.g., Monetisation, App Events)
- Create a new custom collection
- Each property can have up to 7 collections displayed at once
You must have the Editor role to customise reports in the Library.
Note
- Overview cards in reports can be clicked to open related detailed views
- Most reports default to a 28-day date range — always double-check when analysing
- “First user” dimensions relate to user acquisition, while “Session” dimensions relate to session acquisition
- Customising reports allows teams to focus on business-specific KPIs