
Objective
To verify that data from your website or app is successfully being collected and sent to your GA4 property by using the Realtime report and debugging tools like Google Tag Assistant.
Overview
This SOP will guide you through:
- Using the Realtime report in GA4
- Interpreting event-level activity and parameters
- Identifying common reasons data might not be visible
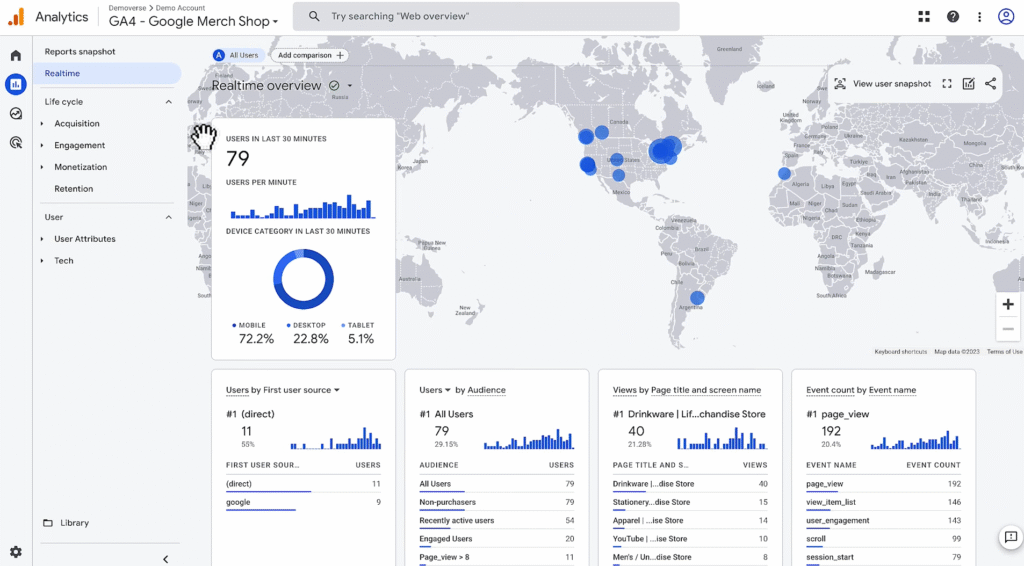
Step 1: Use the Realtime Report to Confirm Data Flow
Once your web or app data stream is created and the Google tag or Firebase SDK is installed, your first place to verify successful data collection is the Realtime report in GA4.
How to access:
- Go to your GA4 property
- Click Reports → Realtime
This report shows user activity from the past 30 minutes.
Note: If you see no users, open your website or app in a new tab so you’re counted as an active user.
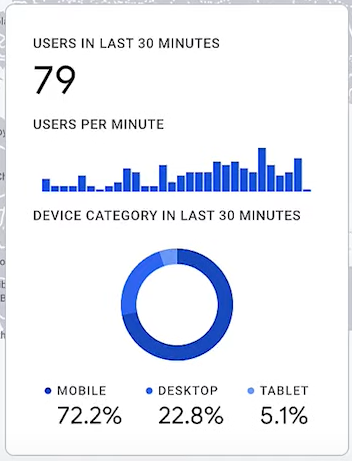
Step 2: Confirm Key Metrics in Realtime Report
Focus on these 2 checks:
1. Is Any User Activity Displayed?
- Look at the “Users in last 30 minutes” count
- If it shows at least one user, data is being collected
2. Are Expected Events Being Captured?
- Scroll to the Event count by event name card
- Events like page_view, click, scroll, or custom events should appear
- Click on an event to explore its parameters, e.g., page_location, button_text
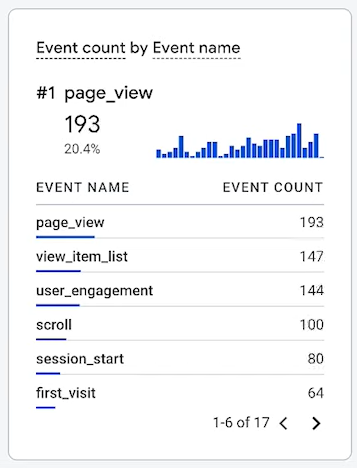
For example, clicking into the page_view event → page_location will reveal the URLs of recently visited pages.
Step 3: What If You Don’t See Any Data?
Here are the most common reasons:
- You may need to wait up to 24 hours after initial setup
- There’s low user traffic, and GA is applying thresholds
- Your Google tag or Firebase SDK isn’t firing correctly
- You’re using filters or misconfigured streams
Action: Open your website or app in a new tab and check again as an active user.