
Objective
To learn how to customise standard reports or build new ones in Google Analytics 4 (GA4) that highlight metrics and dimensions most relevant to your business goals.
Overview
Google Analytics provides many powerful built-in reports. However, your business may require custom views tailored to specific questions or KPIs. With GA4, you can customise existing reports or create new reports from scratch, helping you:
- Focus on relevant metrics
- Save time during analysis
- Align reporting views with evolving business goals
Each GA4 property supports up to 150 custom reports.
Step 1: Understand Customisation Options
What You Can Customise in a Report:
- Primary dimension (e.g., Session source/medium instead of default channel group)
- Displayed metrics (e.g., replace Events with Conversions)
- Chart types (Line, Bar, or Scatter)
- Report filters (e.g., limit report to web traffic only)
- Summary cards
- Link/unlink reports from collections
Step 2: Customise an Existing Report
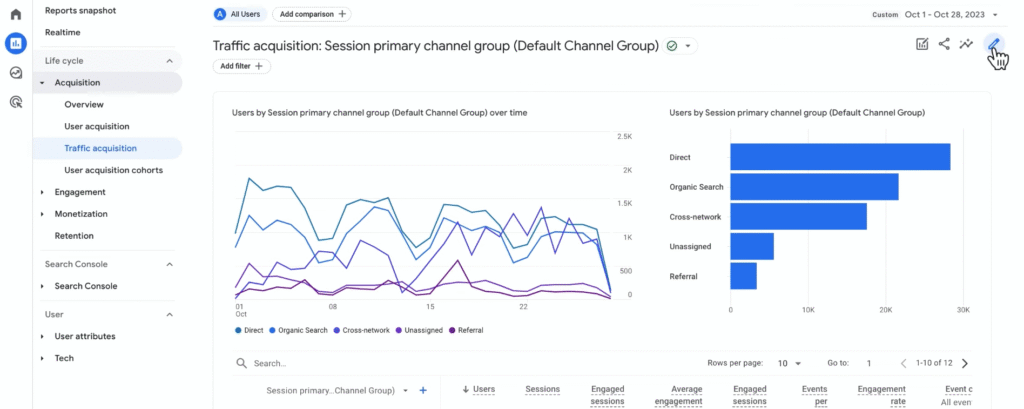
Let’s walk through editing the Traffic acquisition report.
- Navigate to Reports → Acquisition → Traffic acquisition
- Click the pencil icon (✏️) in the top right corner
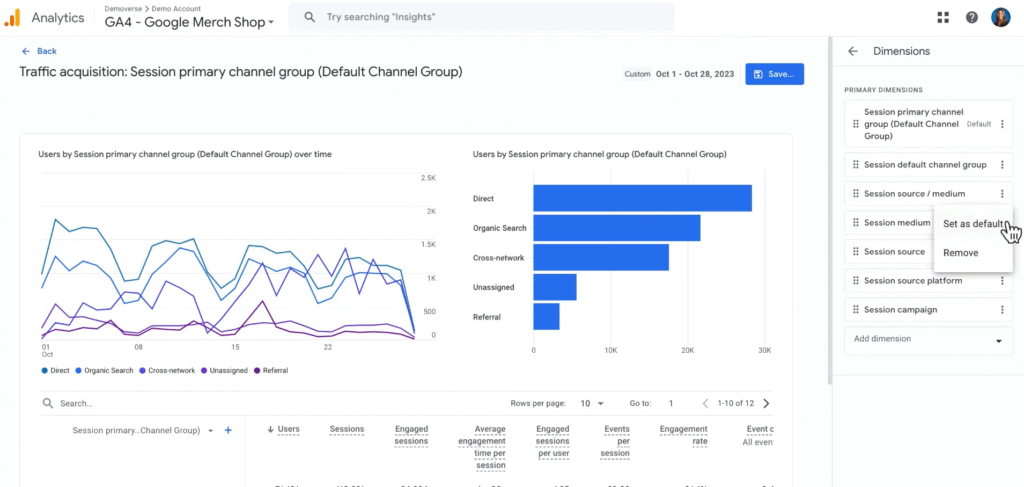
- Under Dimensions, click into the tile to view all available options. You can either add another dimension or set the available dimensions as default or remove them entirely.
- For example, locate Session source/medium, click the three dots, and choose Set as default
- Click Apply
Optional: Hide a Chart Type
- Scroll to the chart section
- To hide a chart, click the eye icon next to it (e.g., hide Bar Chart and keep Line Chart)
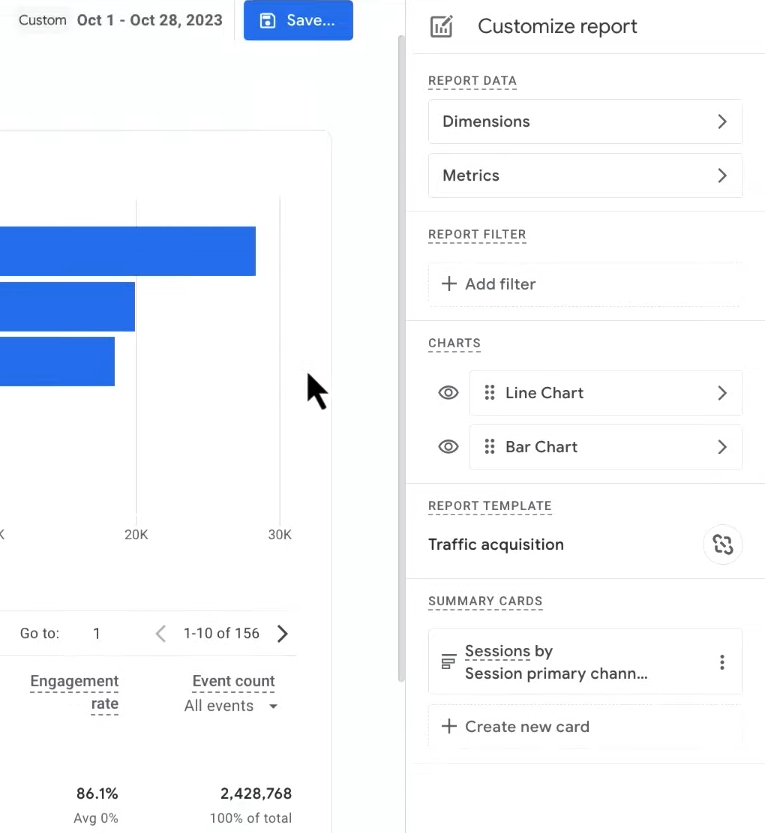
Save Your Customisation
When saving the report:
- Choose Save as a new report to avoid overwriting the original
- Give it a clear name, e.g. Session Source / Medium Report
Step 3: Create a Custom Report from Scratch
Sometimes, you may want to build a new report entirely. For example, one that includes custom dimensions like member level.
Steps:
- Navigate to Reports → Library
- Scroll down and click Create new report → Create detail report
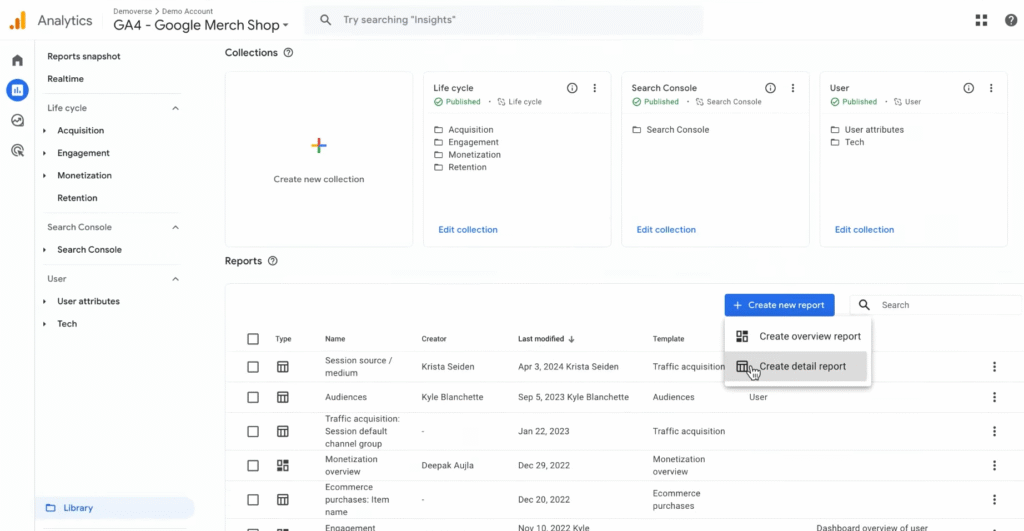
- Choose Blank to start from scratch
- Select your dimensions (e.g., member_level)
- Select your metrics:
- Sessions
- Total users
- Purchases
- Total revenue
- Click Save and name your report (e.g., Member Info)
Step 4: Use Filters to Refine Your Reports
Custom filters allow you to target specific subsets of your data. Example:
Scenario: Your web team has rolled out a new user experience and you want to measure its impact.
- Edit your custom Traffic acquisition report
- Add a filter where Platform exactly matches web
- Keep only the Line chart to visualise engagement changes over time
- Focus on Average engagement time per session as the key metric
Step 5: Understand the Differences – Reports vs. Explorations
| Feature | Customised Reports | Explorations |
| Purpose | Tailor standard reports for repeat use | Ad hoc deep dive analysis |
| Dimensions/Metrics | Focused and summarised | Vast and flexible |
| Visualization | Simple chart and table options | Many techniques (funnel, path, segment overlap) |
| Who it’s for | Report consumers (e.g., marketing managers) | Data analysts or strategic decision-makers |
| Use case example | View top traffic sources with conversions | Explore user journeys that lead to purchases |
Step 6: Business Questions You Can Answer With Custom Reports
| Business Question | Customisation Tip |
| What is the conversion rate for key events across campaigns? | Add conversion metrics + campaign dimension |
| How are my custom audience segments engaging with content? | Include custom dimensions (e.g., membership level or signup source) |
| How much revenue does organic search generate? | Filter by source/medium = “google / organic” and show revenue metric |
| Are site changes improving engagement on mobile? | Filter platform = web, break down by device category, use Avg. engagement time metric |
Final Tips
- Use custom reports to monitor performance regularly
- Use explorations for deep analysis or strategic decision-making
- Add your custom reports to the Library and include them in report collections for easier access