
Objective
To help users analyse data subsets within GA4 reports by applying filters and comparisons — enabling deeper insight into user behaviour, traffic patterns, and device interactions.
Overview
This SOP will guide you through:
- Understanding dimensions and metrics
- Applying filters to isolate specific data
- Using comparisons to view data side-by-side
- Customising and sharing filtered and compared reports
Step 1: Understand Dimensions vs. Metrics
Before filtering or comparing, it’s important to understand the building blocks of GA4 reports:
| Type | Definition | Example |
| Dimension | Descriptive attribute of your data (text-based) | Country, Device, Event Name |
| Metric | Quantitative measurement (numerical) that can be counted or averaged | Event count, Sessions, Users |
The dimension “country” might include values like “United States” or “Vietnam”, while the metric “event count” will show how often something occurred.
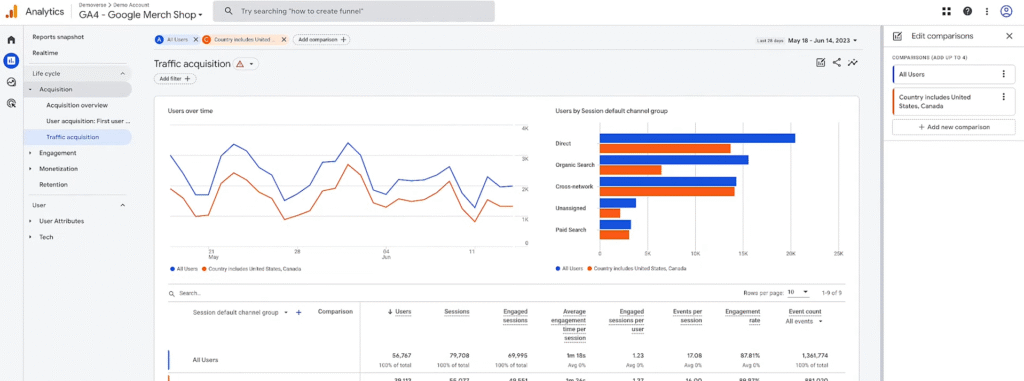
Step 2: Apply Report Filters
Filters allow you to limit the data shown in your report by specific dimension values.
How to Apply a Filter:
- Open any detail report (e.g., Traffic Acquisition)
- Click Add filter + at the top of the report
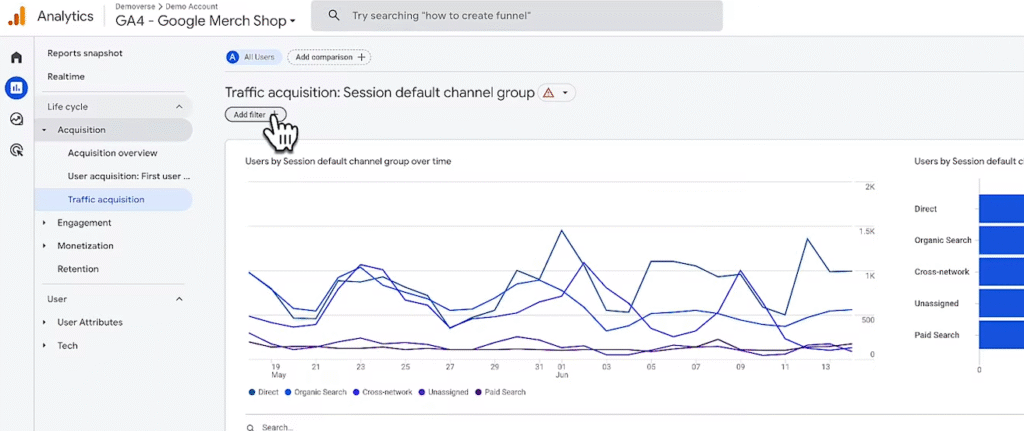
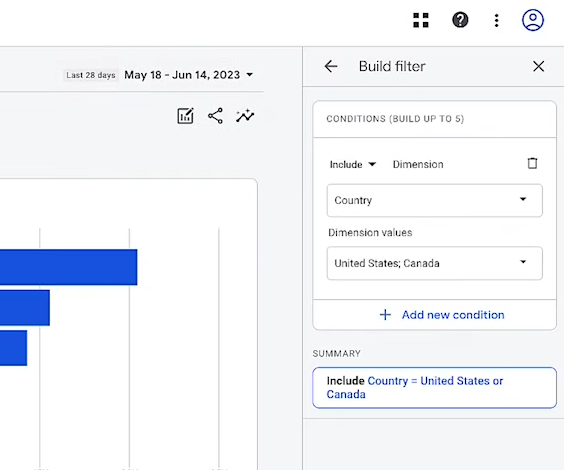
- Choose a dimension (e.g., Country)
- Select one or more values (e.g., United States, Canada)
- Click Apply
You can set up to 5 filter conditions in a single filter.
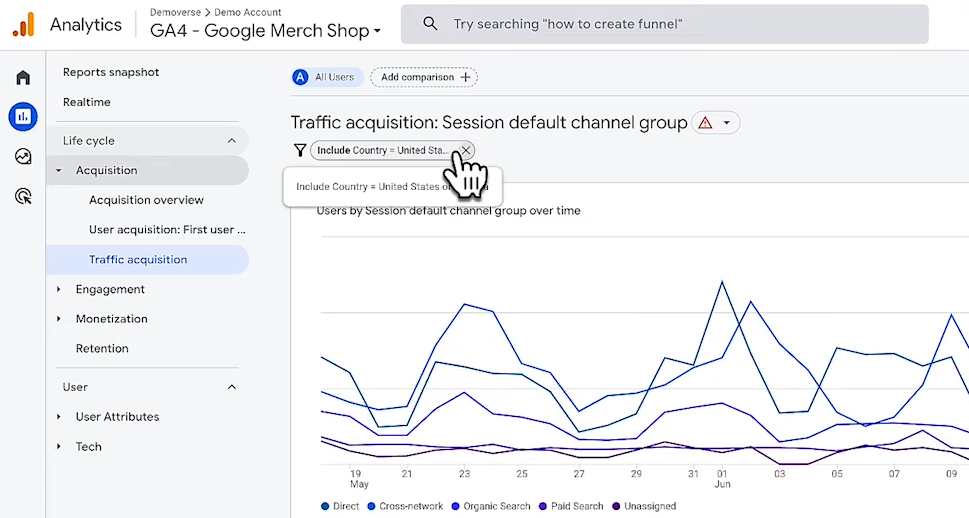
To Edit or Remove a Filter:
- Click the filter badge at the top of the report
- Modify the condition or click X to remove it
Filters are temporary and reset when you leave the report.
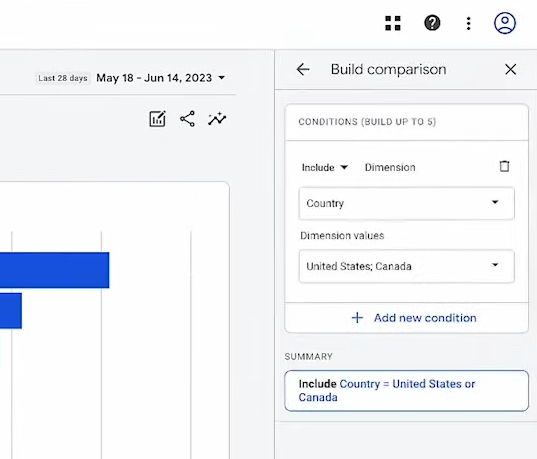
Step 3: Use Comparisons to View Data Side-by-Side
Unlike filters (which hide unselected data), comparisons let you compare two or more segments of users simultaneously.
How to Add a Comparison:
- In any report, click Add comparison
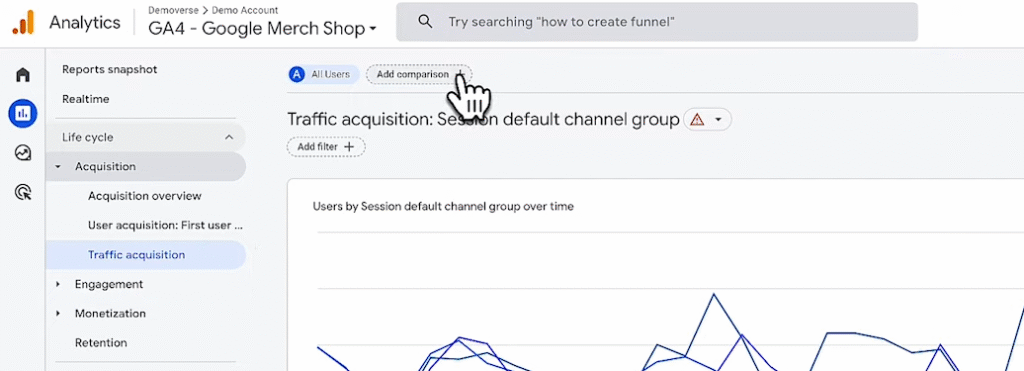
- Choose a dimension (e.g., Device Category)
- Add a condition (e.g., Mobile)
- Click Apply
- Repeat the steps to add a second comparison (e.g., Desktop)
Comparisons are color-coded and include All Users by default, so you can view each data set side-by-side.
To Edit or Remove Comparisons:
- Click the comparison segment label at the top
- Modify the dimension or values, or click X to delete
Comparisons will persist across reports until removed, but may show blank results if not compatible with certain reports.
Examples of Filter and Comparison Use Cases
Use Filters To:
- View traffic from specific countries or regions only
- Focus on users who triggered a particular event
- Exclude internal or test data
Use Comparisons To:
- Compare iOS vs Android engagement
- Measure purchase behaviour from different traffic sources
- Evaluate new vs returning user behaviour
Step 4: Share Customised Reports
After applying filters or comparisons:
- Click the Share icon in the top-right of the report
- GA4 will generate a shareable link
- Share with any team member who has access to the GA4 property
The link includes all visible filters, comparisons, and date ranges applied.
Note
- You can apply both filters and comparisons in the same report
- Not all dimensions are compatible with every report — incompatible ones will be greyed out
- Filters are temporary, while comparisons persist until removed