
Objective
To guide users through leveraging Explore in GA4 to investigate user behavior in depth by visualizing user journeys using techniques like Free Form, Funnel, Path, Cohort, User Lifetime, and Segment Overlap.
Overview
This SOP will help you:
- Explore your data using multiple visualization techniques
- Detect anomalies and investigate suspicious spikes
- Build funnels to track user flows and identify drop-offs
- Use pathing to discover behavioral patterns
- Answer common business questions with custom insights
- Apply segments, filters, and breakdowns for precision targeting
Step 1: Use Free Form Exploration to Identify Anomalies
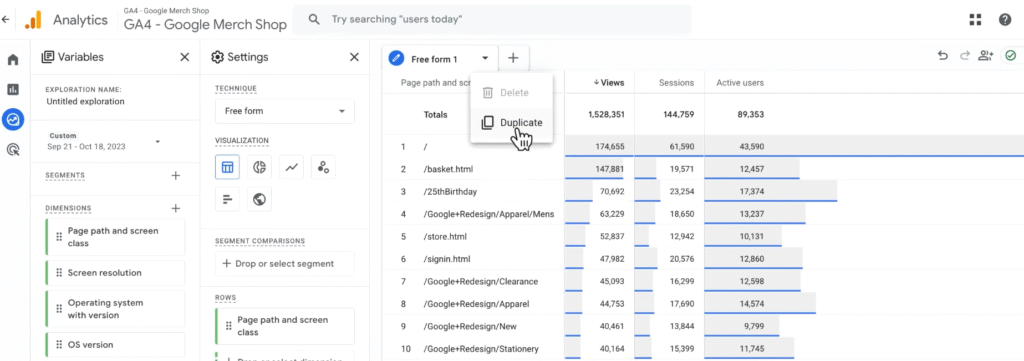
Create a Base Free Form Table:
- Go to Explore in the GA4 left-hand menu
- Open a Blank exploration or use the Free Form template
- Add dimensions (e.g. Page path, Screen class)
- Add metrics (e.g.Views, Sessions, Active users)
- Build a basic table visualization by dragging dimensions/metrics into Rows and Values
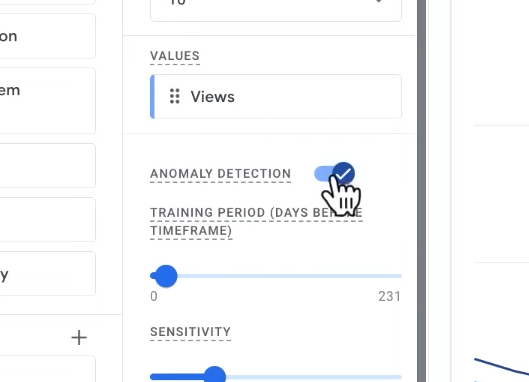
Enable Anomaly Detection:
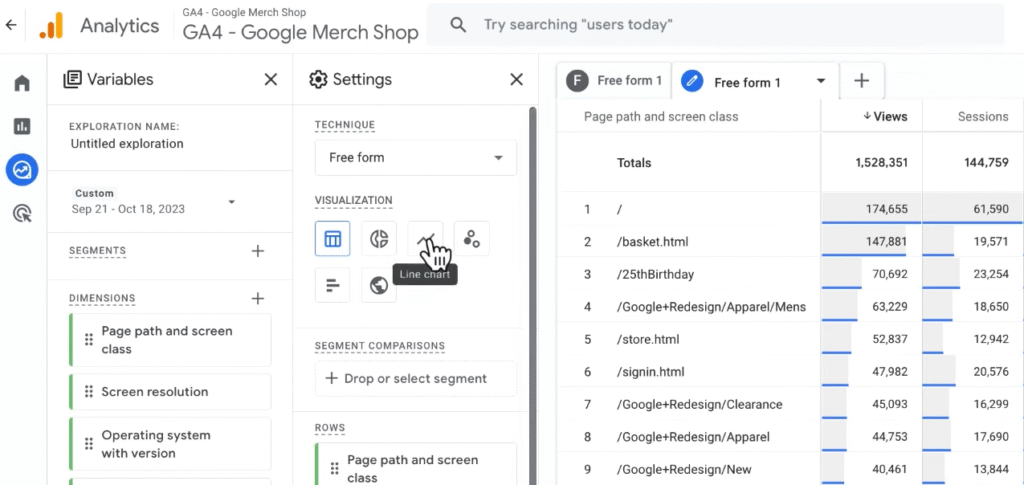
- Duplicate the tab to maintain a table report while also digging into a new visualisation type, change visualisation to Line chart
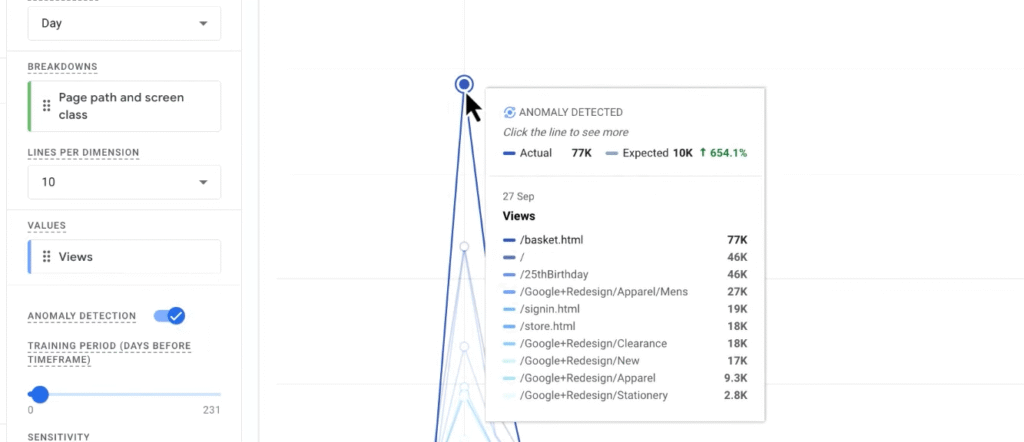
- Enable the Anomaly Detection slider
- Identify unexpected spikes (e.g., 77,000 /basket views on Sept. 27 vs. 10,000 expected)
Step 2: Investigate the Source of Anomalous Traffic
- Right click on the Anomaly bubble -> Select Create segment from selection
This will create a segment which includes all views that match the criteria that the Dimensions match.
- Apply the created anomaly segment to your original table
- Add Operating System with Version as a dimension
- Compare against previous week’s data
Example: Traffic from Macintosh Intel 13.5 appears only on spike date — likely spam or bot activity
Exclude Suspicious Traffic with Filters:
- Add a filter in Tab Settings
- Exclude OS versions containing Intel 13
Filtering can drastically reduce inflated views (e.g., from 440,000 to 163,000)
Step 3: Build a Funnel to Track User Progression
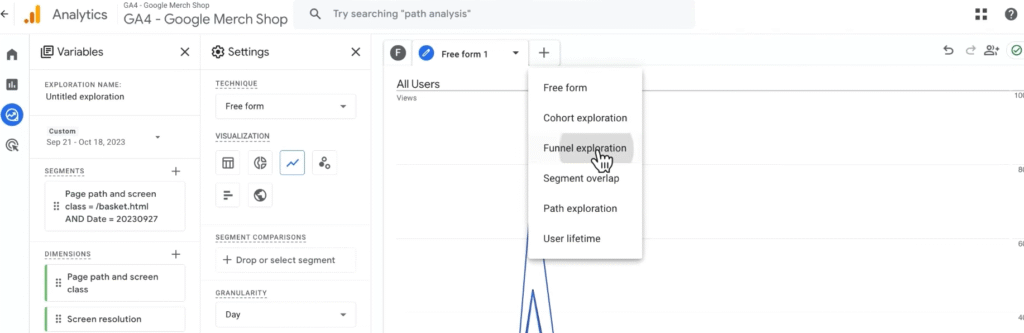
Use Funnel Exploration to Visualise Steps:
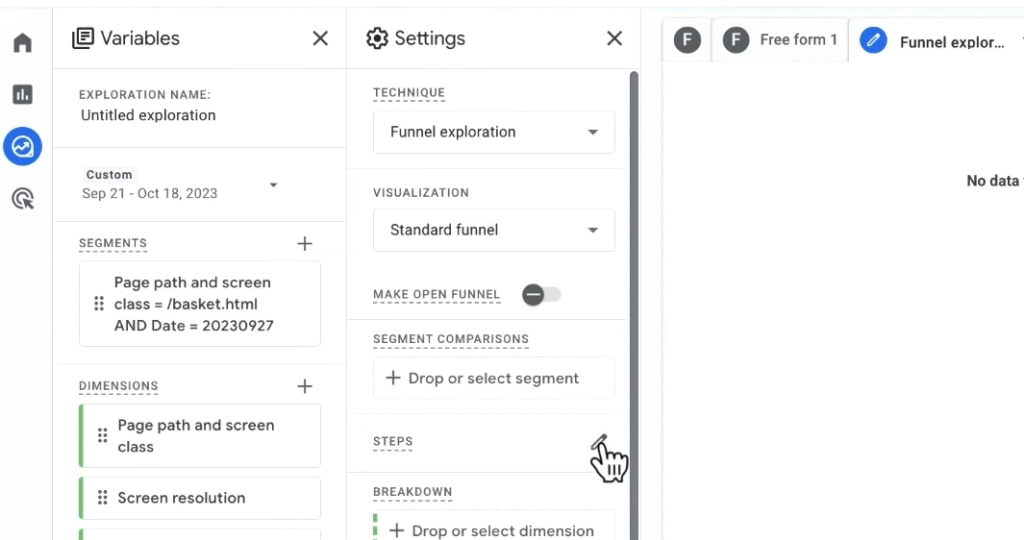
- Open a new tab → Select Funnel Exploration
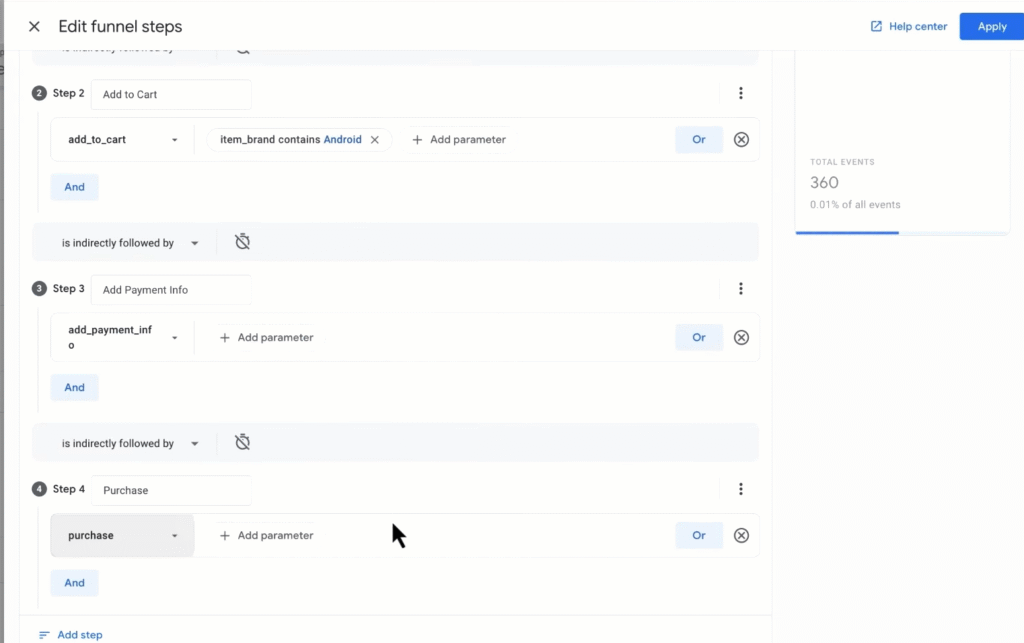
- Click Edit Steps and define:
- Step 1: Create a view of the website homepage -> Give the first step a name (e.g. Homepage View) -> Select Add new condition -> Select Dimensions (e.g. Page path and screen class) -> Add filter -> Add conditions
- Step 2: Name the step (e.g. Add to Cart) -> add_to_cart with item_brand contains Android
- Step 3: Name the step (e.g. Add Payment Info) -> add_payment_info
- Step 4: Name the step (e.g. Purchase) -> purchase
Choose “is indirectly followed by” unless doing exact sequencing.
Apply Breakdowns:
- Add Device category as a breakdown
- Observe behavior differences (e.g., mobile starts strong but desktop dominates conversions)
Right-click on the funnel to Include only desktop users for refined analysis.
Step 4: Use Path Exploration to Discover User Flow
Set a Backward Path from Key Events:
- Open a new tab → Select Path Exploration
- Click Start Over → Ending Point
- Choose add_to_cart as the ending event
- Change next node to Page path
This reveals what users were doing before adding items to cart — e.g., visiting the 25th-birthday landing page
Use this insight to optimize pages or highlight high-performing content.
Step 5: Explore Other Advanced Techniques
| Technique | Use Case |
| Cohort Exploration | Analyse how users with shared traits (e.g., acquisition date) behave over time |
| User Lifetime | Measure long-term value, churn probability, and revenue from different campaigns |
| Segment Overlap | Identify intersections between key audiences (e.g., Mobile + Returning Users + High Spenders) |
Each technique can be customized and filtered just like Free Form.
Step 6: Apply and Share Your Findings
Use Explore to Answer Business Questions Like:
- What content leads to conversions?
- Where are users dropping out in my sales funnel?
- Which campaigns lead to the highest long-term value?
- Which devices or platforms perform best?
Use filters, segments, and breakdowns to pinpoint these insights precisely.
To Share an Exploration:
- Click the Share icon in the top-right corner
- Recipients can view but not edit
- To collaborate, duplicate the report and share access to the property