
Objective
To enable users to leverage the Explore feature in GA4 for advanced data analysis, including the use of custom dimensions, filters, segments, and advanced techniques like funnels, paths, and segment overlaps.
Overview
In this SOP, you’ll learn how to:
- Navigate the Explore section and its interface
- Create explorations using variables, settings, and the canvas
- Use templates and advanced techniques like free form, funnel, path, and cohort analyses
- Apply filters, segments, and breakdowns
- Save, share, and understand differences between Explore and standard Reports
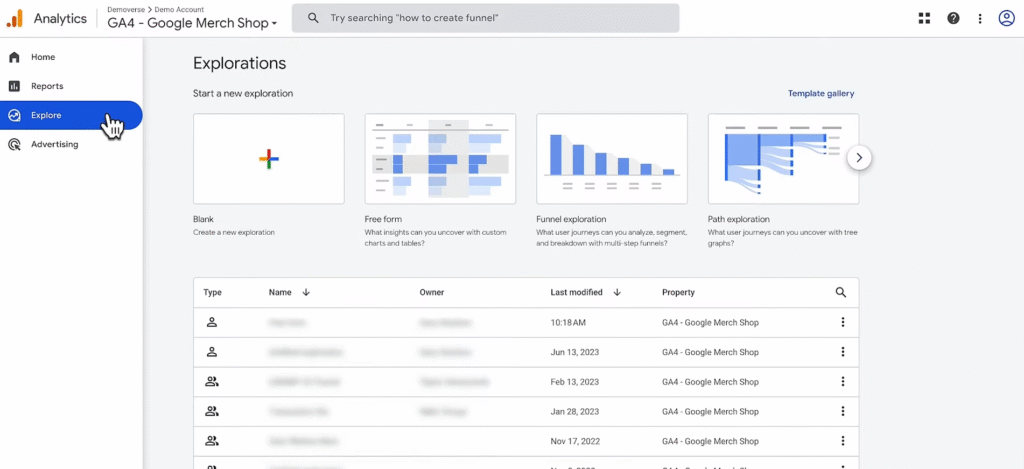
Step 1: Access the Explore Section
From the GA4 interface:
- Click Explore in the left-hand navigation menu
- You’ll land on the Explorations homepage, where you can:
- Create a new exploration from scratch or a template
- Reopen saved explorations
- View explorations shared with you
Explorations are private by default. Only the creator can view/edit unless explicitly shared.
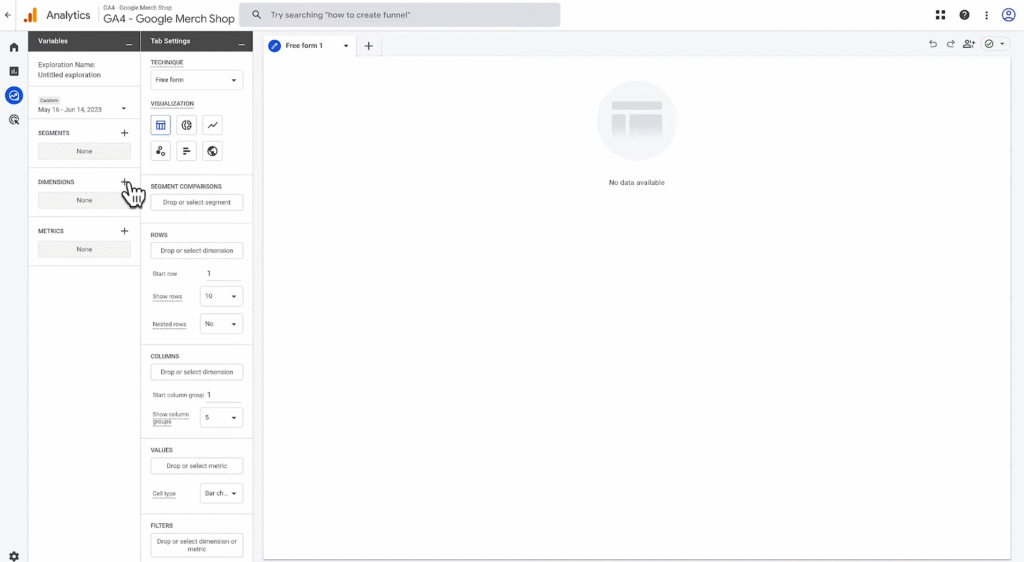
Step 2: Understand the Explore Interface
When you open a template or blank canvas, the interface has three main panels:
| Panel | Function |
| Variables | Select and import dimensions, metrics, segments; rename your exploration |
| Tab Settings | Configure rows, columns, filters, visualisation style, and breakdowns |
| Canvas | Displays your visualised data (can support multiple tabs per exploration) |
Step 3: Create an Exploration
Start with a Blank Exploration:
- Click Blank to open a fresh exploration
- Click the + icon next to Dimensions
- Add: Page path, Device category, Screen class, Session source/medium
- Select Import
- Click the + icon next to Metrics
- Add: Sessions, Active users, Views
- Select Import
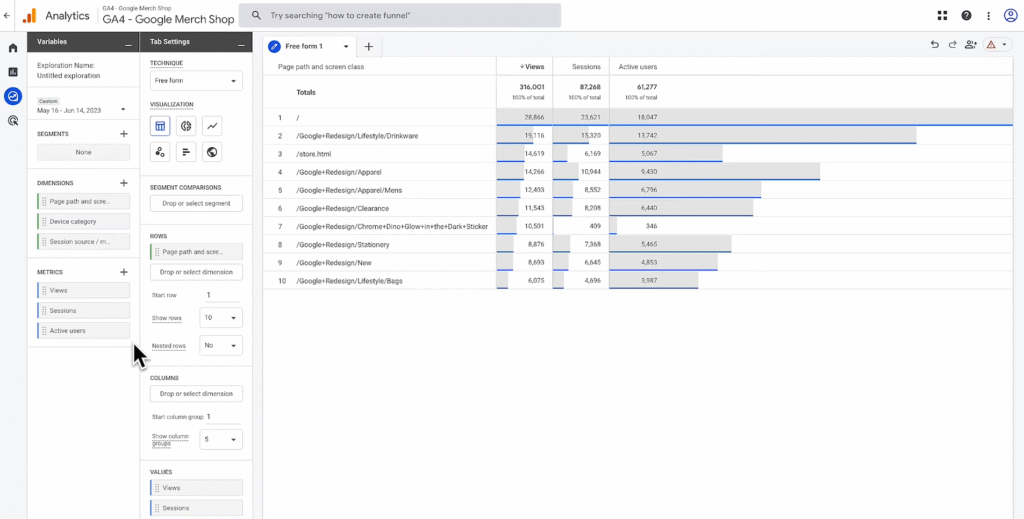
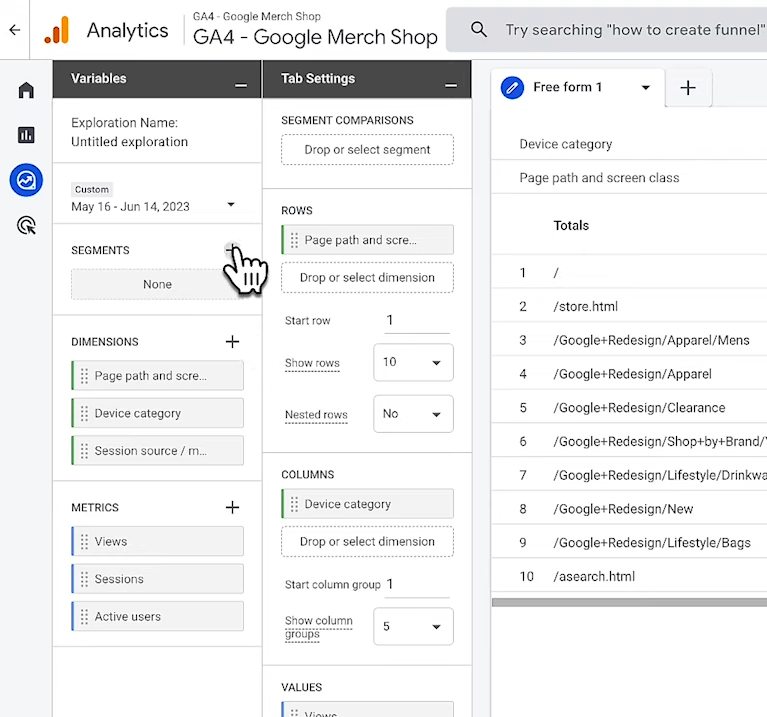
Build Your Report:
To build a report, you’ll need to double click or drag-and-drop dimensions and metrics from the Variables pane to the Tab settings pane
- Drag Dimensions to Rows
- Drag Metrics to Values
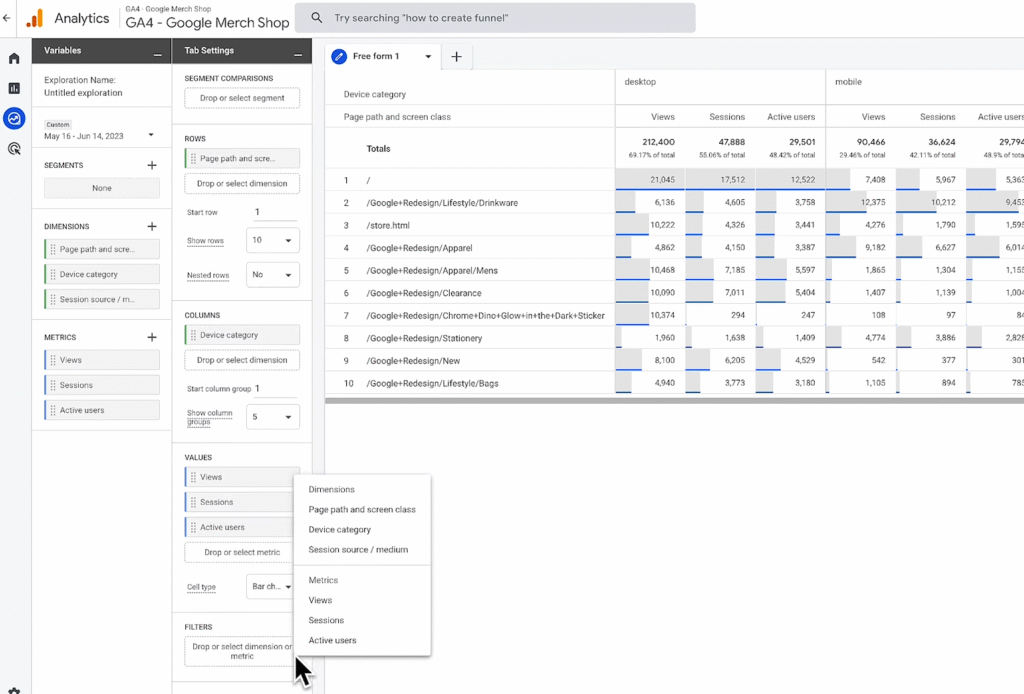
- To break data down further:
- Add more Dimension to Columns (for compact comparative layout)
- Or add to Rows (for stacked breakdowns)
Step 4: Apply Filters and Segments
Apply a Filter:
- Scroll to Filters at the bottom of the Tab Settings panel
- Select a dimension (e.g., Session source/medium)
- Set condition: Exactly matches → Google / Organic
- Click Apply
This limits all data in the tab to organic search traffic.
Create and Apply a Segment:
- In the Variables pane, click + next to Segments
- Choose from:
- Templates (e.g., Demographics, Technology)
- Suggested (e.g., Recently active users)
- Predictive (e.g., Likely 7-day purchasers)
- Or create Custom segment
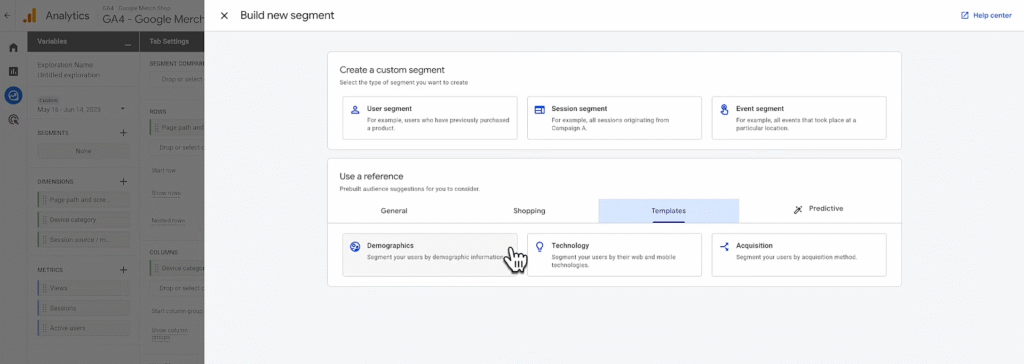
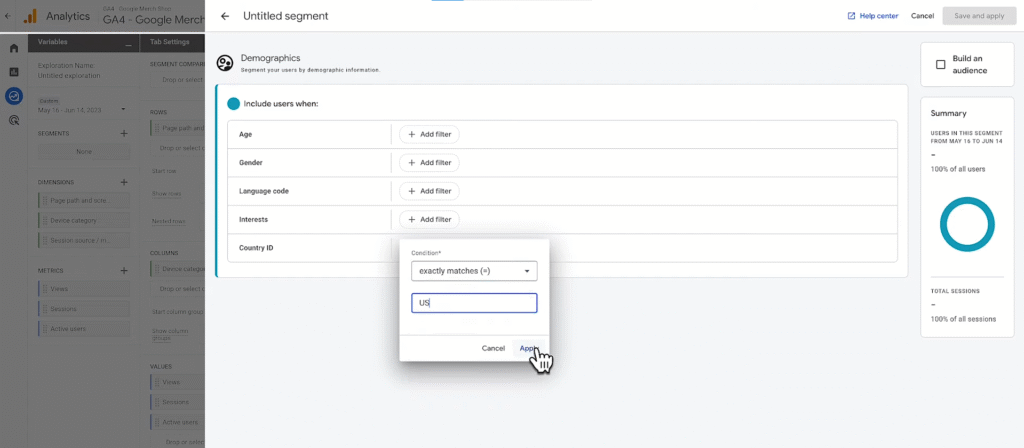
Example:
3. Select Templates → Select Demographics → Set Country ID exactly matches US
4. Name the segment: US Traffic → Save and Apply
Segments allow you to isolate and analyse specific user groups.
Step 5: Save and Share Your Exploration
- Click the Share icon to generate a view-only link (others can’t edit)
- To make edits to a shared exploration:
- Duplicate it via the 3-dot menu on the Explorations homepage
Duplicated explorations are private to the new owner and fully editable.
Use Different Exploration Techniques
Explore offers powerful techniques to visualise behaviour and uncover insights:
| Technique | Use Case |
| Free Form | Custom tables and charts with drag-and-drop flexibility |
| Funnel Exploration | Visualise how users move through steps (e.g., landing > view > purchase) |
| Path Exploration | Discover all navigational paths users take, including unexpected loops |
| Segment Overlap | Find where multiple user segments intersect |
| Cohort Analysis | Study behaviour over time by user group (e.g., sign-up date cohorts) |
| User Lifetime | Track the long-term value of acquired users |
All techniques can be created from templates or added as tabs in a single exploration.
Understand Data Differences Between Reports and Explore
You might see slight discrepancies between Reports and Explore due to:
| Reason | Explanation |
| Sampling | Explore may use sampled data for large datasets (Reports use full data) |
| Processing Delay | Data in Reports may process faster than Explore (esp. within 48 hours) |
| Dimension Support | Not all dimensions in Reports are available in Explore |
For critical reports, reduce date range to limit sampling in Explore.