
Objective
To help users understand the purpose and functionality of predefined reports in GA4, including Realtime, Lifecycle, and User reports — enabling deeper insights into traffic behaviour, user engagement, monetisation, demographics, and technology usage.
Overview
This SOP will guide you through:
- Realtime report usage
- Key Lifecycle report categories: Engagement, Monetisation, Retention
- User reports: Demographics and Technology
- How to interpret insights and customise report dimensions
Realtime Report
The Realtime report gives you immediate insight into what’s happening on your site or app within the last 30 minutes.
What it shows:
- Active users and sessions
- Geographic location
- Devices used
- Traffic sources
Use cases:
- Monitor traffic spikes from a new blog post or social media campaign
- Check the impact of a same-day promotion
- Test if events and conversions are firing correctly
Realtime data may be delayed for app users if devices are offline or battery-saving features are active.
Engagement Reports
Found under the Lifecycle collection, engagement reports show how users interact with your site or app.
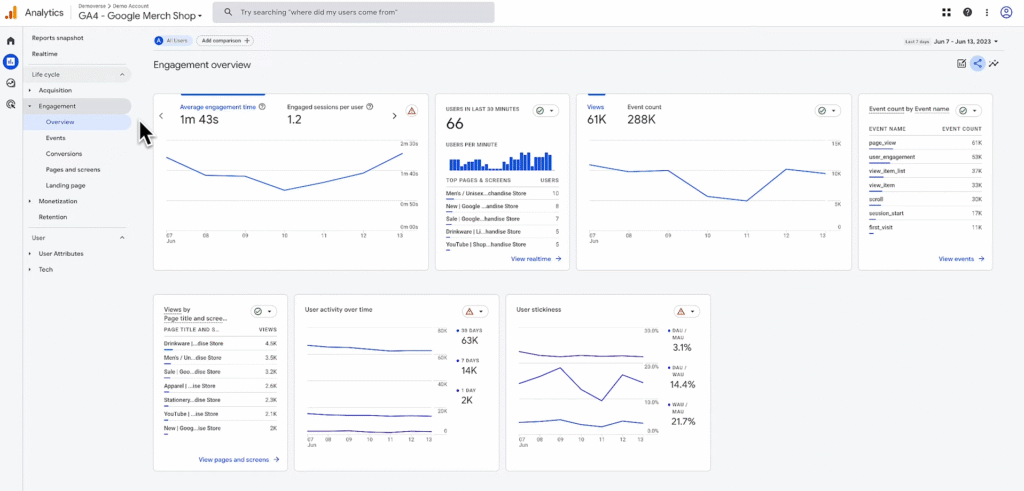
Engagement Overview
- A card-based summary of all engagement metrics
- Includes top events, conversions, pages/screens, and landing pages
Events Report
- Lists all tracked events
- Shows total event counts and number of users who triggered each event
- Use this report to optimise user flows and uncover drop-offs
Conversions Report
- Focuses on high-value actions marked as conversions
- Useful for tracking goal completions (e.g., purchases, form submissions)
Pages and Screens Report
Shows performance by:
- Page title (e.g., “Product Page”)
- Page path (e.g., /product/123)
- Screen name (for apps)
This helps you understand which pages/screens retain the most engagement.
Landing Page Report
- Displays which pages users land on first
- Insight into first impressions and entry-point effectiveness
Monetisation Reports
Also under Lifecycle, these reports provide insights into purchases, revenue, and in-app monetisation.
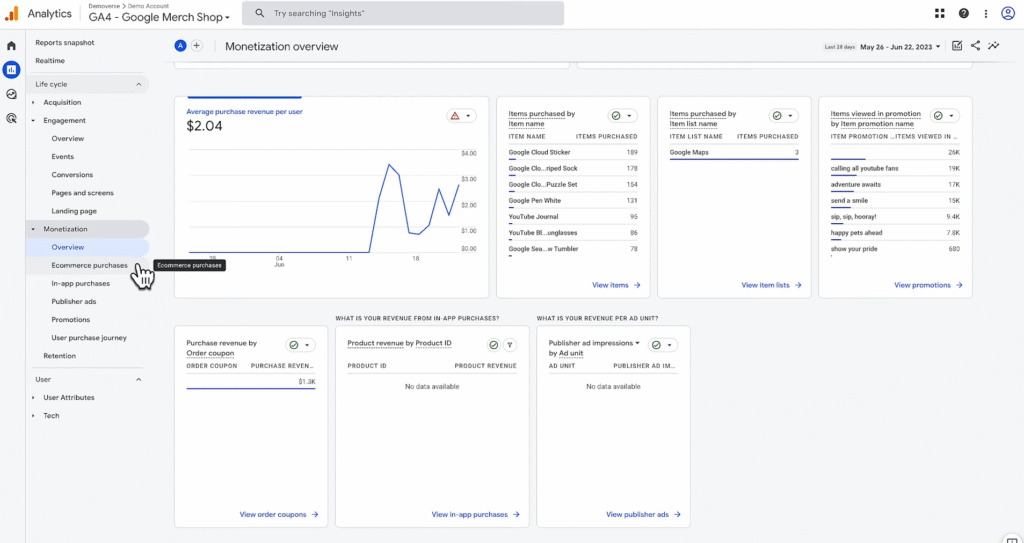
Monetisation Overview
Card summary of ecommerce and in-app revenue data
Ecommerce Purchases Report
- Tracks items sold, revenue, and quantity
- Requires implementation of recommended ecommerce events
In-App Purchases (Apps Only)
Reports purchases made within a mobile app (e.g., upgrades, virtual goods)
Publisher Ads Report (Apps Only)
- Displays ad revenue data from mobile apps
- Helps measure monetisation performance of display ads
Retention Report
This report tracks how well your website or app retains users over time.
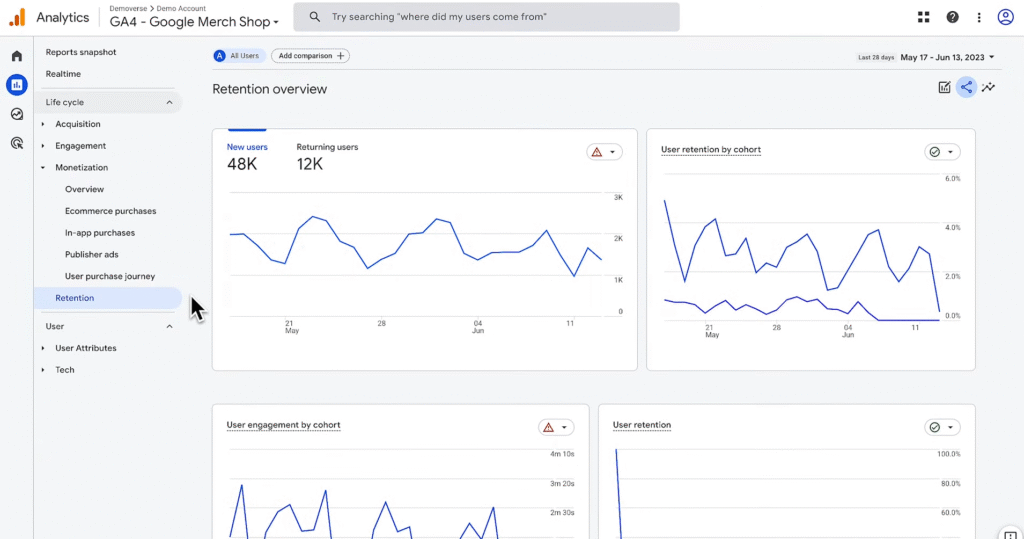
Key Cards in the Retention Overview:
- New vs. Returning Users – Measures user loyalty
- Retention by Cohort – Groups users by acquisition date
- User Engagement by Cohort – Tracks average engagement duration over time
- Lifetime Value (LTV) – Calculates average revenue from new users over 120 days
Cohorts help you compare different user groups based on behaviour and value.
User Reports — Demographics and Tech
These reports help you understand who your users are and how they access your property.
Demographics Overview
Card summary of:
- Age
- Gender
- Language
- Country
- Interests
Enable Google Signals for more accurate demographic and cross-device data.
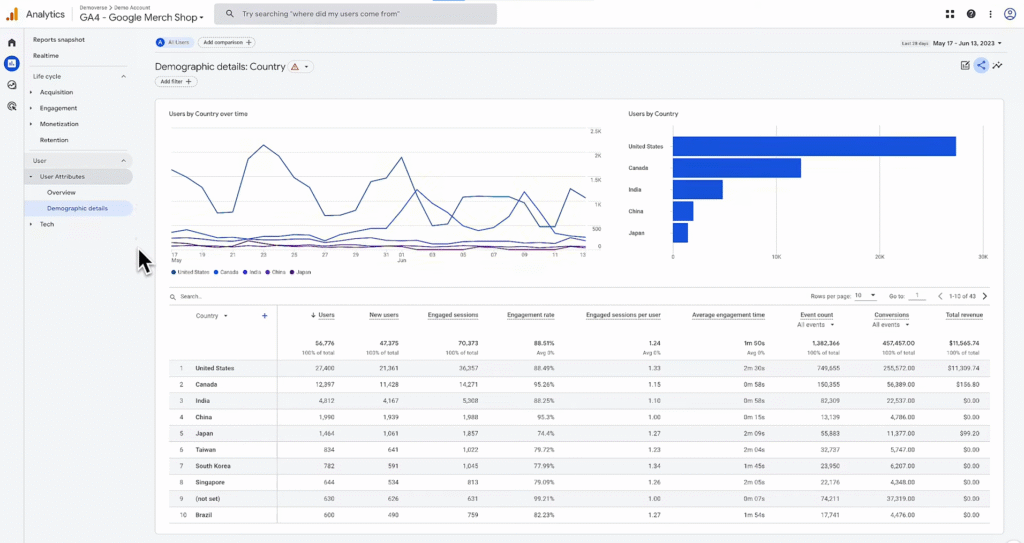
Demographics Details
- Table report defaulting to Country
- You can change the primary dimension to others (e.g., age, interest category)
Tech Overview
Cards showing user devices, browsers, screen resolution, and platforms
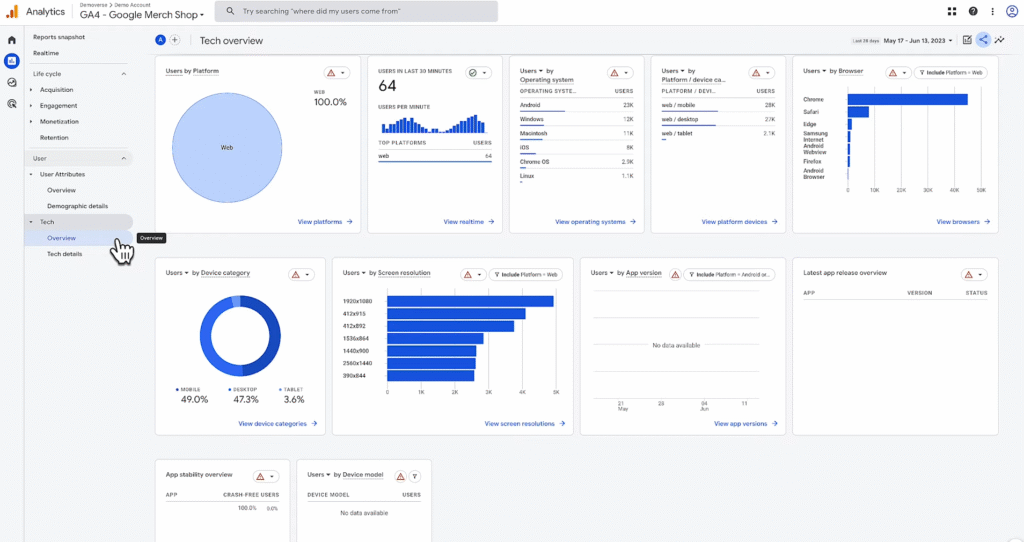
Tech Details
- Table view defaulting to Browser
- You can adjust dimensions to Device category, App version, etc.
Tech reports are useful for debugging issues and optimising performance across platforms.
Note
- Some data (e.g., demographics) may only be available for a subset of users, depending on device settings or consent
- All table reports allow you to:
- Change primary dimensions
- Add secondary dimensions
- Adjust date ranges and filters